
By David J. Sangree, MAI, CPA, ISHC
November 2026
Every year, the TEA Global Experience Index (TEA Index) gives the industry benchmarks for which waterparks drew the biggest crowds in the previous year. The 2025 report, which was issued in the fall of 2026, provides estimates of attendance for the top 20 outdoor waterparks in the United States. We wanted to take the next step and ask: How are those same leading waterparks stacking up in 2026 compared to 2025 numbers?
To answer this question, we analyzed visitation trends using Placer.ai, a location analytics platform. We evaluated the top 20 outdoor waterparks identified in the TEA Index, comparing year-to-date 2026 visitation with the same period in 2025. We also identified the 20 largest indoor waterparks by size and conducted a similar analysis of those properties using Placer.ai data.
About Placer.ai Data
It is important to understand what these numbers represent. Placer.ai does not report actual attendance. It estimates visits using aggregated location data from a large panel of U.S. mobile devices. This makes Placer.ai a strong tool for spotting direction and relative change: how a park compares with its own history and how a group of properties move together. It is less reliable as a precise count for any single property, and its figures may not match a park’s actual attendance or the TEA Index.
This matters most for indoor waterpark resorts. The location boundary for a resort generally captures everyone on the property, including hotel guests who may never visit the waterpark, conference attendees, and day visitors. For these reasons, we treat indoor results as resort visitation trends rather than waterpark attendance.
Outdoor Waterparks
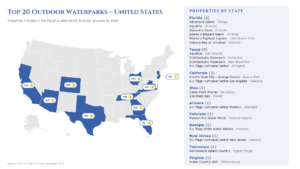
The following chart presents aggregate attendance for the TEA Index top 20 outdoor waterparks over the past four years, along with year-to-date 2026 figures. It also shows the percentage change in attendance from one year to the next.
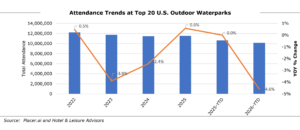
With most of the outdoor season now behind us, the October year-to-date comparison gives a good read on how 2026 played out:
- Visitation down overall. Combined year-to-date visitation is about 4.6% below the same period in 2025, and 14 of the 20 parks are trending behind last year.
- Variants are wide. Five parks are down more than 10%, while three are up more than 10%. Only four parks are within 5% of last year in either direction.
- Disney Parks stick out. Disney’s two waterparks had a strong 2025, with special promotions allowing Disney Resort guests to visit them without admission fees. Both were operating again after extended closures, which makes those parks a bit of an outlier when comparing the entire set. Year-to-date 2026 numbers report significant drops for Disney Parks. If we set those two properties aside, the rest of the group is down more modestly at under 2% for year-to-date 2026.
- Regional results are mixed. Excluding Disney, Florida parks are down slightly as a group. The Texas parks are up as a group, though results vary from park to park, and several Six Flags Hurricane Harbor waterparks in the West and Southwest are running ahead of last year.
- Bright spots. Six parks are ahead of 2025, led by Schlitterbahn New Braunfels, Six Flags Hurricane Harbor Arlington and Phoenix, Discovery Cove, Hyland Hills Water World, and Knott’s Soak City.
Indoor Waterparks and Resorts
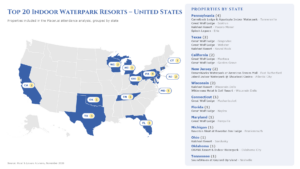
The following chart presents aggregate attendance for the top 20 indoor waterparks over the past four years, along with year-to-date 2026 figures. It also shows the percentage change in attendance from one year to the next.
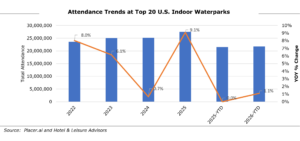
Indoor waterparks and resort properties are far less exposed to weather, which is reflected in their attendance numbers:
- Overall visitation is up modestly. Combined year-to-date visitation is up about 1% from 2025. That gain is driven largely by two newer resorts (OKANA and Great Wolf Lodge Mashantucket) still building their audience; excluding them, the group is down slightly, by less than half a percent.
- Most properties are trending slightly behind. Thirteen of the 20 resorts are below last year, but the declines are generally small. Twelve of the 20 are within 5% of 2025, and only one is down more than 10%.
- Established brands are feeling some pressure. Great Wolf Lodge’s established locations and the Kalahari Resorts are each running a few percentage points behind last year as groups, as new competitive indoor waterpark supply continues to enter the market and consumers reckon with higher gas prices.
- Standouts are a mix of new and reinvested. Camelback Lodge & Aquatopia and OKANA are both running well ahead of 2025, and SoundWaves at Gaylord Opryland, Bavarian Blast at Bavarian Inn Lodge, Kalahari Pocono Manor, and Great Wolf Lodge Houston and Mashantucket are also up.
What It Means
The year-to-date picture shows two segments moving in different ways. Outdoor waterparks had a softer 2026, with wide swings from park to park that reflect weather, operating changes, and economic considerations, making for tougher comparisons against strong 2025 results. Indoor waterpark resort attendance was much steadier, but most established properties are giving up a little ground as newer resorts open and mature.
Location data is one tool among many. Combined with operating data, market research, and on-the-ground experience, it helps paint a clearer picture of how guests are actually behaving.
This is the first in what we plan to make a regular series. H&LA intends to track year-to-date visitation for these waterparks and resorts each quarter and report on how the trends develop, including which properties and regions are gaining momentum, where softness persists, and how newer resorts are settling in as they mature. Check back with us next quarter for the latest update.
Hotel & Leisure Advisors (H&LA) is an international hospitality consulting firm. H&LA specializes in appraisals, feasibility studies, impact analyses, economic impact studies, and litigation support for hotels, resorts, waterparks, surf parks, casinos, conference and convention centers, golf courses, ski resorts, and other leisure real estate. Our experienced consultants travel nationwide, analyzing hospitality trends, studying leisure industries, and understanding local communities. We focus on our clients’ competitive markets and provide thorough and thoughtful analysis of hospitality properties. Our consultants have analyzed and prepared studies on more than 4,200 properties in all 50 states, Canada, and internationally.
David Sangree, MAI, CPA, ISHC, President, dsangree@hladvisors.com, 216-810-5800
Heidi Banak, Operations Manager, hbanak@hladvisors.com, 216-403-6653